Water Temperature
Water temperature is a physical property expressing how hot or cold water is. As hot and cold are both arbitrary terms, temperature can further be defined as a measurement of the average thermal energy of a substance.
Air Temperature
Air temperature is a measure of how hot or cold the air is.
Barometric Pressure
Measurement of the pressure exerted by the atmosphere.
Wind Speed
How fast is the wind blowing.
Wind Gust Speed
Maximum measured 5-second wind speed over the observation interval.
Significant Wave Height
An estimate of the wave height corresponding to the average of the highest one-third (33%) of the waves during a given time period.
Mean Wave Direction
Mean Wave Direction is the mean of all the individual wave directions in a time-series representing a certain sea state.
Maximum Wave Height
Maximum observed wave height during the sampling period.
Dominant Wave Period
Dominant period is the period with maximum energy and is always either the swell period or the wind-wave period.
Current Speed
The speed of the ocean current measured.
Current Direction
The direction the ocean current is flowing toward.
North Current Velocity
North-south component of the ocean current.
East Current Velocity
East-west component of the ocean current.
Wind Direction
Meteorological conventions (direction from which the wind blows, measured from true north).
Salinity
Salinity is computed by a known functional relationship between the measured electrical conductivity of seawater (CON), temperature (OTMP) and pressure. Salinity is computed using the Practical Salinity Scale of 1978 (PSS78) and reported in Practical Salinity Units.
Maine Buoy Table Information
<table class="table tbl--info">
<thead>
<tr>
<th>Parameter</th>
<th>Definitions</th>
</tr>
</thead>
<tbody>
<tr><td>SWH</td><td>Significant Wave Height</td></tr>
<tr><td>SWD</td><td>Mean Wave Direction</td></tr>
<tr><td>MWH</td><td>Maximum Wave Height</td></tr>
<tr><td>SWP</td><td>Dominant Wave Period</td></tr>
<tr><td>WSPD</td><td>Wind Speed</td></tr>
<tr><td>WDIR</td><td>Wind Direction</td></tr>
<tr><td>WGST</td><td>Wind Gust</td></tr>
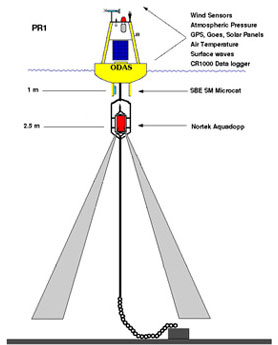
<tr><td>CSPD</td><td>Current Speed (2.5 m)</td></tr>
<tr><td>CDIR</td><td>Current Direction (2.5 m)</td></tr>
</tbody>
</table>
Chlorophyll
Chlorophyll is a green pigment present in plants, algae, and cyanobacteria that is responsible for the absorption of light for photosynthesis. The concentration of chlorophyll is an indicator of the amount of phytoplankton and primary productivity in the ocean.
CO₂ Air
CO₂ Air (formally known as xCO₂) is a measurement of CO₂ concentration in the atmosphere. It is expressed as a mole fraction of atmospheric carbon dioxide near the surface in units of micromoles per mole (µmol/mol). While CO₂ naturally varies on daily and seasonal timescales, there is evidence of ongoing ocean acidification caused by global CO₂ emissions.
CO₂ Sea
CO₂ Sea (formally know as xCO₂ Sea) is a measurement of the concentration of carbon dioxide (CO₂) in the ocean. The measurement is expressed as a mole fraction of CO₂ in seawater near the ocean surface in micromoles per mole (µmol/mol) units. While CO₂ naturally varies on daily and seasonal timescales, there is evidence of ongoing ocean acidification caused by global CO₂ emissions.
pH
pH is a logarithmic measure used to determine the acidity or alkalinity of a solution. The average pH of the ocean is approximately 8.1. The pH scale is inverse to the hydrogen ion concentration, which means that higher levels of hydrogen ions result in greater acidity and a lower pH value. The pH of seawater plays an important role in the ocean's carbon cycle, and there is evidence of ongoing ocean acidification caused by global carbon dioxide (CO₂) emissions.
Barometric Pressure
Barometric or atmospheric pressure is the measurement of air pressure in the atmosphere, specifically, it is the measurement of the weight exerted by air molecules at a given point on Earth. Measurement of barometric pressure is often expressed in millibars (mb). Barometric pressure has important effects on water chemistry and weather conditions. Normal pressure at sea level is 1013.3 mb. Barometric pressure varies with altitude and moisture. A rise in pressure indicates improving weather, while a fall may mean inclement weather.
Salinity
Salinity is the total amount by weight of dissolved salts in one kilogram (1000 grams) of seawater. It is measured in parts per thousand (ppt) or Practical Salinity Units (PSU). The major ions dissolved in seawater are chloride, sodium, sulfate, magnesium, calcium, and potassium. The average ocean salinity is 35 PSU, and freshwater salinity is usually less than 0.5. Salts affect water's physical and chemical properties like conductivity, density, freezing point, and heat capacity.
Turbidity
Turbidity is a parameter that measures the amount of suspended material such as sediments, plankton, algae, dissolved colored organic compounds, as well as inorganic and organic matter in the water column. It is an optical property of water which indicates the quantity of light scattered by the material present in the water. As the concentration of these light-blocking particles increases, the turbidity of water also increases, causing it to become denser and less clear.
SST
Sea Surface Temperature (SST) is the temperature of ocean water near the surface. This temperature directly or indirectly impacts the rate of all physical, chemical, and biological processes occurring in the ocean. SST is a strong indicator of ocean and atmosphere interactions and provides data on global climate systems.
Dissolved Oxygen
Dissolved Oxygen (DO) refers to the amount of oxygen gas present in water and available for aquatic organisms. The solubility of oxygen in water is influenced by various factors, such as water temperature, salinity, and atmospheric pressure. Salinity-compensated O₂ is a term used to describe a dissolved oxygen measurement in seawater that has been adjusted for its salinity.

 Radar
Radar Buoys
Buoys